python dashboard

Top 5 Python libraries every developer should master in 2025

Top 5 Python Libraries Every Developer Should Master in 2025

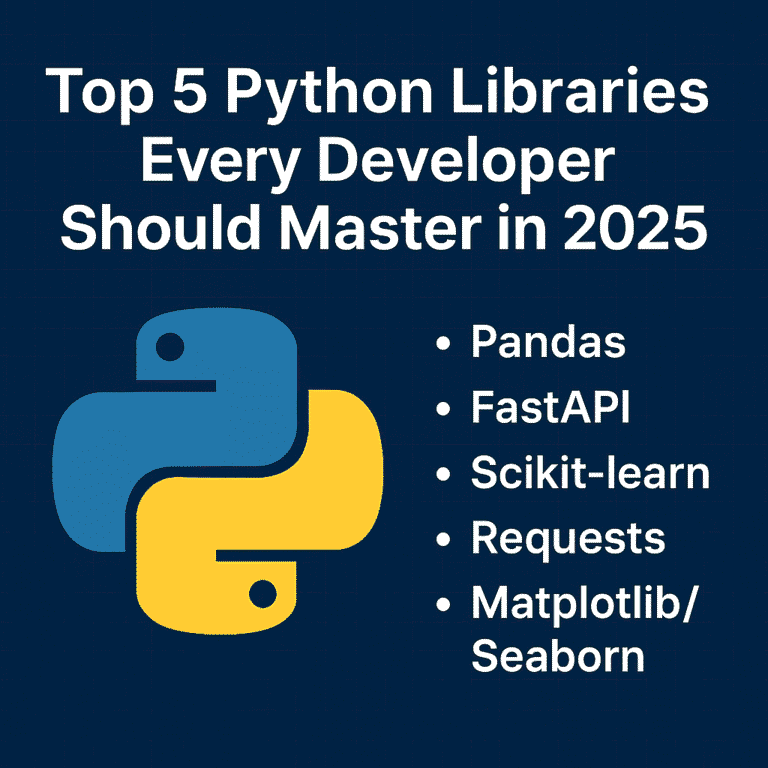
As we move further into 2025, Python continues to be one of the most popular programming languages in the world. Its clean syntax, vibrant community, and powerful libraries make it a favorite among industry developers—from web development and data science to AI, automation, and beyond. But Python’s true strength lies in its ecosystem. With the right libraries, you can do more with less code—faster, cleaner, and more efficiently. Whether you’re just starting your Python journey or looking to sharpen your existing skills, here are five essential libraries every Python developer should know this year. 1. Pandas – Your Go-To Tool for Data Manipulation In today’s data-driven world, knowing how to work with data is a must—and Pandas makes it easy. It’s the standard library for handling structured data in Python and is widely used in fields like data science, finance, web development, and machine learning. Why Learn Pandas: Real-world uses: Data analysis, reporting dashboards, cleaning raw datasets, and even feeding machine learning models. 2. FastAPI – The New Standard for Building APIs FastAPI is quickly becoming the framework for building modern web APIs in Python. It’s fast (really fast), easy to use, and comes with automatic documentation out of the box. Why Developers Love FastAPI: Why it matters in 2025: More and more apps are going API-first. FastAPI helps you build scalable, production-ready APIs that integrate easily with frontend and mobile apps. 3. Scikit-learn – Machine Learning Made Simple Scikit-learn is the perfect place to start if you’re curious about machine learning. It abstracts away the complexity of ML algorithms and provides a consistent interface for quickly trying things. What You Can Do with It: Why learn it: Even if you’re not a full-time data scientist, understanding ML basics can give your apps a smarter edge. 4. Requests – The Simplest Way to Talk to the Web Every app these days needs to fetch or send data from somewhere—APIs, websites, services. The requests The library makes working with HTTP super simple and intuitive. Why Requests are a Must-Have: Use Cases: Calling external APIs (like weather, payment, or social media), scraping data, automating web interactions, or even testing your backend services. 5. Matplotlib & Seaborn – Visualize Like a Pro Data is only useful when you can understand and communicate it. That’s where Matplotlib and Seaborn come in. Learn to: Why it’s essential: Visualization helps you (and others) make better decisions based on your data. Whether it’s a report for your boss or a dashboard for your users, good visuals matter. Bringing It All Together These five libraries cover the entire journey of modern Python development: Mastering this toolkit gives you the power to build full-stack data-driven applications, from scratch to production. How to Start Learning (A 10-Week Roadmap) Here’s a simple plan you can follow: Conclusion The Python ecosystem is vast, but you don’t need to learn everything. These five libraries form a solid foundation that will serve you in almost every tech role—whether you’re building apps, analyzing data, or exploring AI. Start with one library and build something small. If you want to combine all of these, consider using the Streamlit library to quickly build dashboards. Keep going—the skills you develop now will open doors throughout your career. Follow my Streamlit blog.

Top 5 Python Libraries Every Developer Should Master in 2025 Read More »

How I Built a COVID-19 Dashboard in 10 Minutes Using Streamlit

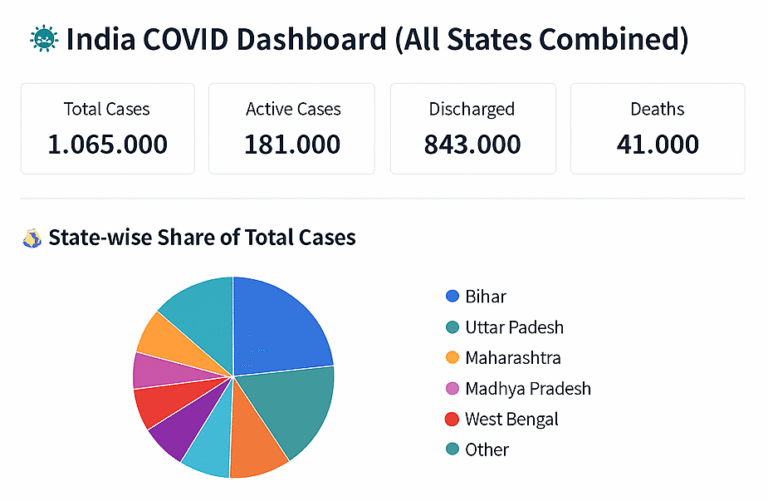
Streamlit is a Python library that lets you build web apps super easily. Think of it as a way to turn your Python scripts into interactive websites without having to learn web development. So imagine you’ve got some data analysis code or a machine learning model, and you want to show it off or let people play around with it. Normally, you’d need to learn HTML, CSS, JavaScript – all that web stuff. With Streamlit, you just write Python, and it handles the web part for you. You can add things like sliders, buttons, file upload boxes, and charts with just a few lines of code. When someone moves a slider or uploads a file, your app automatically updates. It’s pretty neat. The best part is how fast you can go from idea to working app. You write your Python code, add some Streamlit commands, and boom – you’ve got a web app running locally. Want to share it? Deploy it to their free hosting service. It’s become popular with data scientists and anyone doing machine learning because you can quickly create demos of your models or build dashboards to visualize data. No need to bug the web dev team or spend weeks learning React or whatever. The code is surprisingly simple, too – you’re just adding commands like st.slider() or st.chart() to your existing Python code, and Streamlit figures out how to turn that into a web interface. 🛠 Tools & Libraries pip install streamlit pandas plotly Step 1: Prepare Your CSV Data Create a file named covid_data.csv With the following columns: State,Zone,Total Cases,Active,Discharged,Deaths,Active Ratio,Discharge Ratio,Death Ratio,Population Bihar,Red,10000,2000,7500,500,20,75,5,120000000 Delhi,Orange,8000,1000,6500,500,12.5,81.25,6.25,20000000 … Step 2: Create the Streamlit App (app.py) 1. Import the Libraries pythonCopyEditimport streamlit as st import pandas as pd import plotly.express as px 2. Load the CSV Data pythonCopyEditdf = pd.read_csv(“covid_data.csv”) This line reads the covid_data.csv file into a DataFrame called dfSo we can work with it in the app. 3. Page Configuration pythonCopyEditst.set_page_config(page_title=”India COVID Dashboard”, layout=”wide”) st.title(“🦠 India COVID Dashboard (All States Combined)”) 4. Calculate Metrics pythonCopyEdittotal_cases = df[“Total Cases”].sum() active_cases = df[“Active”].sum() discharged = df[“Discharged”].sum() deaths = df[“Deaths”].sum() These lines add up the columns across all rows to get the total national numbers. 5. Show the Metrics in 4 Columns pythonCopyEditcol1, col2, col3, col4 = st.columns(4) col1.metric(“Total Cases”, f”{total_cases:,}”) col2.metric(“Active Cases”, f”{active_cases:,}”) col3.metric(“Discharged”, f”{discharged:,}”) col4.metric(“Deaths”, f”{deaths:,}”) 6. Draw a Pie Chart pythonCopyEditst.subheader(“State-wise Share of Total Cases”) pie = px.pie(df, names=”State”, values=”Total Cases”, title=”Total Cases by State”) st.plotly_chart(pie, use_container_width=True) 7. Draw a Bar Chart pythonCopyEditst.subheader(“State-wise Breakdown of Active, Discharged, and Deaths”) bar = px.bar( df, x=”State”, y=[“Active”, “Discharged”, “Deaths”], barmode=”group”, title=”State-wise Case Category”, height=500 ) st.plotly_chart(bar, use_container_width=True) 8. Optional Data Filter and Table pythonCopyEditwith st.expander(“Show/Filter State-Wise Data”): selected_states = st.multiselect(“Select States to View”, df[“State”].unique(), default=df[“State”].unique()) filtered_df = df[df[“State”].isin(selected_states)] st.dataframe(filtered_df.sort_values(“Total Cases”, ascending=False), use_container_width=True) Step 3: Run the App In your terminal, run: streamlit run app.py Your browser will open the dashboard automatically. on 8501 port http://localhost:8501/ Bonus Ideas Comment below if you like my post

How I Built a COVID-19 Dashboard in 10 Minutes Using Streamlit Read More »

Scroll to Top