PyTorch

Simple linear regression

Imagine you’re a restaurant owner. You notice that on warmer days, more people buy ice cream. If you could quantify that relationship, you could predict sales based on tomorrow’s weather forecast. That’s exactly what simple linear regression does. It’s one of the most fundamental tools in statistics and machine learning. And despite its name, it’s genuinely simple. What Is Simple Linear Regression? At its core, simple linear regression models the relationship between two continuous variables: The method finds the best straight line that describes how Y changes when X changes. Think back to high school algebra: y = mx + b. Linear regression is the same idea, just with fancier terminology and statistical rigor. The Formula (Don’t Worry, It’s Painless) The population model looks like this: Here’s what it means in plain English: Symbol Meaning Plain Translation Y Dependent variable What you’re predicting X Independent variable What you’re using to predict β₀ Intercept Value of Y when X equals zero β₁ Slope How much Y changes when X increases by 1 unit ε Error term Stuff your model can’t explain The fitted model (what you actually use) is simply: Where Ŷ (pronounced “Y-hat”) is your prediction. A Concrete Example Let’s say you want to predict exam scores based on hours studied. Hours Studied (X) Actual Score (Y) 1 55 2 65 3 70 4 80 After running the regression, you get this line: How to interpret this: So if a student studies 5 hours: 45 + 8.5(5) = 87.5 predicted score. Pretty useful, right? How Does It Find the “Best” Line? The method used is called Ordinary Least Squares (OLS) – a name that sounds complicated but isn’t. OLS finds the line that minimizes the sum of squared residuals. What’s a residual? The difference between your actual Y value and your predicted Ŷ value. Imagine drawing a line through your data points. Some points are above the line, some below. The residuals are those vertical distances. OLS squares them all (so negatives don’t cancel positives) and adds them up. The line with the smallest total wins. That’s it. That’s the magic. The Four Assumptions You Should Know Linear regression works well when certain conditions are met. Think of these as the rules of the road: 1. Linearity The relationship between X and Y must be linear. If your data looks like a U-shape or an S-curve, a straight line won’t cut it. 2. Independence Each observation should be independent of the others. This fails with time series data (today’s stock price depends on yesterday’s) or clustered data (students in the same classroom). 3. Homoscedasticity (say that three times fast) The spread of residuals should be roughly constant across all X values. If predictions are wildly inaccurate for high X values but spot-on for low X values, you have a problem. 4. Normality (mostly for inference) The errors should be roughly normally distributed. This matters primarily if you’re calculating confidence intervals or p-values. Quick check: Plot your residuals. If they look random with no obvious patterns, you’re probably fine. How Good Is Your Model? You’ve run the regression. Now what? Here are the key metrics to evaluate your model: R-squared (R²) This tells you what proportion of the variance in Y is explained by X. Ranges from 0 to 1. Higher is better, but beware: adding any variable increases R², even useless ones. Residual Standard Error (RSE) This is the typical size of your prediction errors, measured in the same units as Y. If RSE = 5 points and you’re predicting exam scores, your predictions are typically off by about ±5 points. P-value for the Slope This tests whether the slope is significantly different from zero. When Should You Actually Use It? Simple linear regression shines in these scenarios: Use it when you have one clear predictor, a roughly linear relationship, and you need interpretability over raw predictive power. Quick Python Implementation Want to try this yourself? Here’s a minimal example using statsmodels: The output gives you coefficients, R-squared, p-values, and diagnostic information – everything you need to interpret your model.

Simple linear regression Read More »

Top 20 Python Libraries

Top 20 Python Libraries for 2025

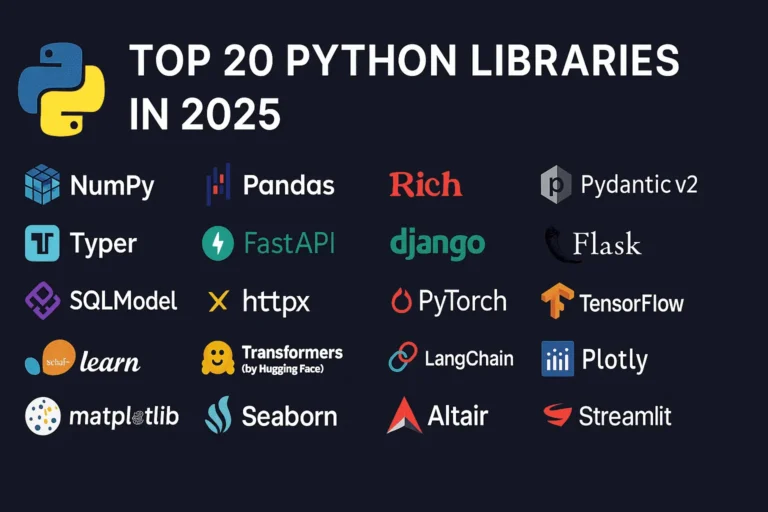
Python continues to dominate the programming landscape in 2025, and much of its success stems from its incredible ecosystem of libraries. Whether you’re building web applications, diving into machine learning, or creating stunning data visualizations, there’s a Python library that can accelerate your development process. In this comprehensive guide, we’ll explore the 20 most essential Python libraries that every developer should know about in 2025, organized by their primary use cases. General Purpose & Utilities 1. NumPy – The Foundation of Scientific Computing NumPy remains the bedrock of Python’s scientific computing ecosystem. It provides support for large, multi-dimensional arrays and matrices, along with a collection of mathematical functions to operate on these arrays efficiently. Why it matters in 2025: Use cases: Scientific computing, data analysis, image processing, financial modeling 2. Pandas – Data Manipulation Made Easy Pandas is the go-to library for data analysis and manipulation. It provides data structures like DataFrames and Series that make working with structured data intuitive and powerful. Key features: Use cases: Data cleaning, exploratory data analysis, financial analysis, business intelligence 3. Rich – Beautiful Terminal Output Rich has revolutionized how we think about terminal applications. It brings rich text, tables, progress bars, and even images to the command line. What makes it special: Use cases: CLI applications, debugging output, terminal dashboards, developer tools 4. Pydantic v2 – Type-Safe Data Validation Pydantic v2 represents a major leap forward in Python data validation. Built on Rust for performance, it uses Python type hints to validate data at runtime. Why developers love it: Use cases: API development, configuration management, data parsing, form validation 5. Typer – Modern CLI Development Typer makes creating command-line applications as easy as writing functions. From the creators of FastAPI, it brings the same elegant design philosophy to CLI development. Standout features: Use cases: Command-line tools, automation scripts, developer utilities, system administration Web Development 6. FastAPI – The Future of Web APIs FastAPI has quickly become the preferred choice for building modern web APIs. It combines high performance with developer-friendly features and automatic API documentation. What sets it apart: Use cases: REST APIs, microservices, real-time applications, machine learning APIs 7. Django – The Web Framework for Perfectionists Django remains a powerhouse for full-stack web development. Its “batteries included” philosophy and robust ecosystem make it ideal for complex applications. Core strengths: Use cases: Content management systems, e-commerce platforms, social networks, enterprise applications 8. Flask – Lightweight and Flexible Flask continues to be popular for developers who prefer a minimalist approach. Its simplicity and flexibility make it perfect for smaller applications and microservices. Why it endures: Use cases: Microservices, API prototypes, small to medium web applications, educational projects 9. SQLModel – The Modern ORM SQLModel represents the evolution of database interaction in Python. Created by the FastAPI team, it combines the best of SQLAlchemy and Pydantic. Revolutionary features: Use cases: Modern web APIs, type-safe database operations, FastAPI applications 10. httpx – Async HTTP Client httpx is the modern replacement for the requests library, bringing full async support and HTTP/2 capabilities to Python HTTP clients. Advanced capabilities: Use cases: Async web scraping, API integrations, microservice communication, concurrent HTTP requests Machine Learning & AI 11. PyTorch – Deep Learning PyTorch has established itself as the leading deep learning framework, particularly in research communities. Its dynamic computation graphs and Pythonic design make it incredibly intuitive. Key advantages: Use cases: Deep learning research, computer vision, natural language processing, reinforcement learning 12. TensorFlow – Production-Ready ML TensorFlow remains a cornerstone of machine learning, especially for production deployments. Google’s backing and comprehensive ecosystem make it a solid choice for enterprise ML. Enterprise features: Use cases: Production ML systems, mobile ML applications, large-scale deployments, computer vision 13. scikit-learn – Traditional ML scikit-learn is the gold standard for traditional machine learning algorithms. Its consistent API and comprehensive documentation make it accessible to beginners and powerful for experts. Comprehensive toolkit: Use cases: Traditional ML projects, data science competitions, academic research, business analytics 14. Transformers (Hugging Face) – NLP Revolution Transformers has democratized access to state-of-the-art NLP models. The library provides easy access to pre-trained models like BERT, GPT, and T5. Game-changing features: Use cases: Text classification, language generation, question answering, sentiment analysis 15. LangChain – LLM Application Framework LangChain is the go-to framework for building applications powered by large language models. It provides abstractions for chaining LLM calls and building complex AI workflows. Powerful abstractions: Use cases: Chatbots, document analysis, AI agents, question-answering systems Data Visualization 16. Plotly – Interactive Visualization Plotly leads the way in interactive data visualization. Its ability to create publication-quality plots that work seamlessly in web browsers makes it invaluable for modern data science. Interactive capabilities: Use cases: Dashboard creation, scientific publications, financial analysis, interactive reports 17. Matplotlib – The Visualization Foundation Matplotlib remains the foundation of Python visualization. While other libraries offer more modern interfaces, matplotlib’s flexibility and comprehensive feature set keep it relevant. Enduring strengths: Use cases: Scientific publications, custom visualizations, academic research, detailed plot customization 18. Seaborn – Statistical Graphics Made Beautiful Seaborn builds on matplotlib to provide a high-level interface for creating attractive statistical graphics. It’s particularly strong for exploratory data analysis. Statistical focus: Use cases: Exploratory data analysis, statistical reporting, correlation analysis, distribution visualization 19. Altair – Grammar of Graphics Altair brings the grammar of graphics to Python, allowing for declarative statistical visualization. It’s particularly powerful for quick data exploration. Declarative approach: Use cases: Rapid prototyping, data exploration, statistical analysis, simple interactive plots 20. Streamlit – Data Apps in Minutes Streamlit has revolutionized how data scientists share their work. It allows you to create beautiful web applications with just Python code, no web development experience required. I have created a dashboard with Streamlit blog, please see here. Rapid development features: Use cases: Data science prototypes, ML model demos, internal tools, executive dashboards Choosing the Right Libraries for Your Project When selecting libraries for your Python projects in 2025, consider these factors: Web Development: Data Science: AI Applications: CLI Tools: The Future of Python Libraries

Top 20 Python Libraries for 2025 Read More »

Scroll to Top